
This article introduces further key performance indicators (KPIs) that are considered vital in understanding a hotel asset’s performance, not just on a revenue and profitability basis in relation to the hotel’s room inventory, but also to consider how efficiently and effectively space is utilised within the entire hotel operation or in selected parts. This will enable a hotel to be assessed on a similar basis as other classes of real estate and not solely by those with a more detailed understanding of the hotel sector.
Financial Management KPIs
KPIs refer to a set of ratios that help compare the performance and progress of a business in relation to its strategic plans or intentions. Performance indicators play a critical role in evaluating past performance and planning future decisions. Measuring business performance is the first step in the improvement process, but without knowledge and understanding of the entire operation there can be no purposeful action.
-
Penetration Index
Hotel room sales is a highly competitive business. Guests can shop hundreds of hotels on a single website with a variety of comparison tools, including maps, pricing, and past guest reviews. Revenue managers have limited pricing power when a hotel’s available room nights are largely unsold. However, you do have control over how you set up your hotel to compete aggressively for your target guests.
Competitive set penetration shows the relative strength of a subject property against a selection of competitive hotels. It is created for each of the major descriptive statistics – occupancy, average daily rate, and RevPAR – by dividing the subject by comp set figures using the STAR Report.
Get a good understanding of the relative quality of the competitive set in your STAR as the basis of your analysis. Tour the properties consistently to establish up quick rules of thumb for how to underwrite a hotel.
Your fair share of the market is defined by a 100% penetration index. Your property will rarely reach 100% penetration on all metrics. This would mean that your hotel is running right in the middle of the pack. In most cases, the subject will be above or below the set.
-
Profit Margins
The USALI standard hotel financial statements have three major expense categories – departmental, undistributed, and fixed. Each of these is followed by profitability to that point, and opportunity exists at each expense level for improving operational efficiency and profitability.
Think of each expense category in terms of its influence in hotel operations. Departmental profit is related to the front-line, direct guest interaction. Gross operating profit following undistributed expenses is associated with back of the house operations. EBITDA following fixed expenses is linked to asset management.
Become a massive consumer of profit margin data at all levels to build mental connections between profitability at all levels. These market and industry standard data points will help you quickly identify areas for opportunity in a new investment.
Note, in the case of undistributed and fixed expenses, there are additional expenses – namely management fees and FF&E reserves – that produce a second level of profitability. These are typically taken as a percentage of operating revenue, so margins are easy to translate.

-
RevPAR
RevPAR, along with Average Daily Rate (ADR) and Rooms Occupancy (%), is one of the three main KPIs used to measure a hotel’s performance and success in managing its room inventory. It is calculated by dividing a hotel’s net room revenue (after discount and sales taxes and net of breakfast or other meals) by the total number of available rooms or by multiplying a hotel’s ADR by its rooms occupancy.
Pitfalls of RevPAR
There are, however, several pitfalls to relying solely on RevPAR as an indicator of a hotel’s complete financial performance.
The main issue is that this metric does not consider that, for hotels with substantial non-rooms operating departments (particularly food and beverage and conference operations), rooms revenue may only account for perhaps half of the hotel’s total revenue.
These include hotels with substantial food and beverage (and meeting and conference) operations and other non-rooms operating departments. In such cases, RevPAR would only reflect a portion of a hotel’s revenue performance, disregarding all other sources of revenues. This will result in an inaccurate analysis when comparing hotel performances not only on a revenue basis, but also in terms of profitability, as different departments also yield a different contribution to profitability. A higher RevPAR does not always indicate an overall healthier financial performance.
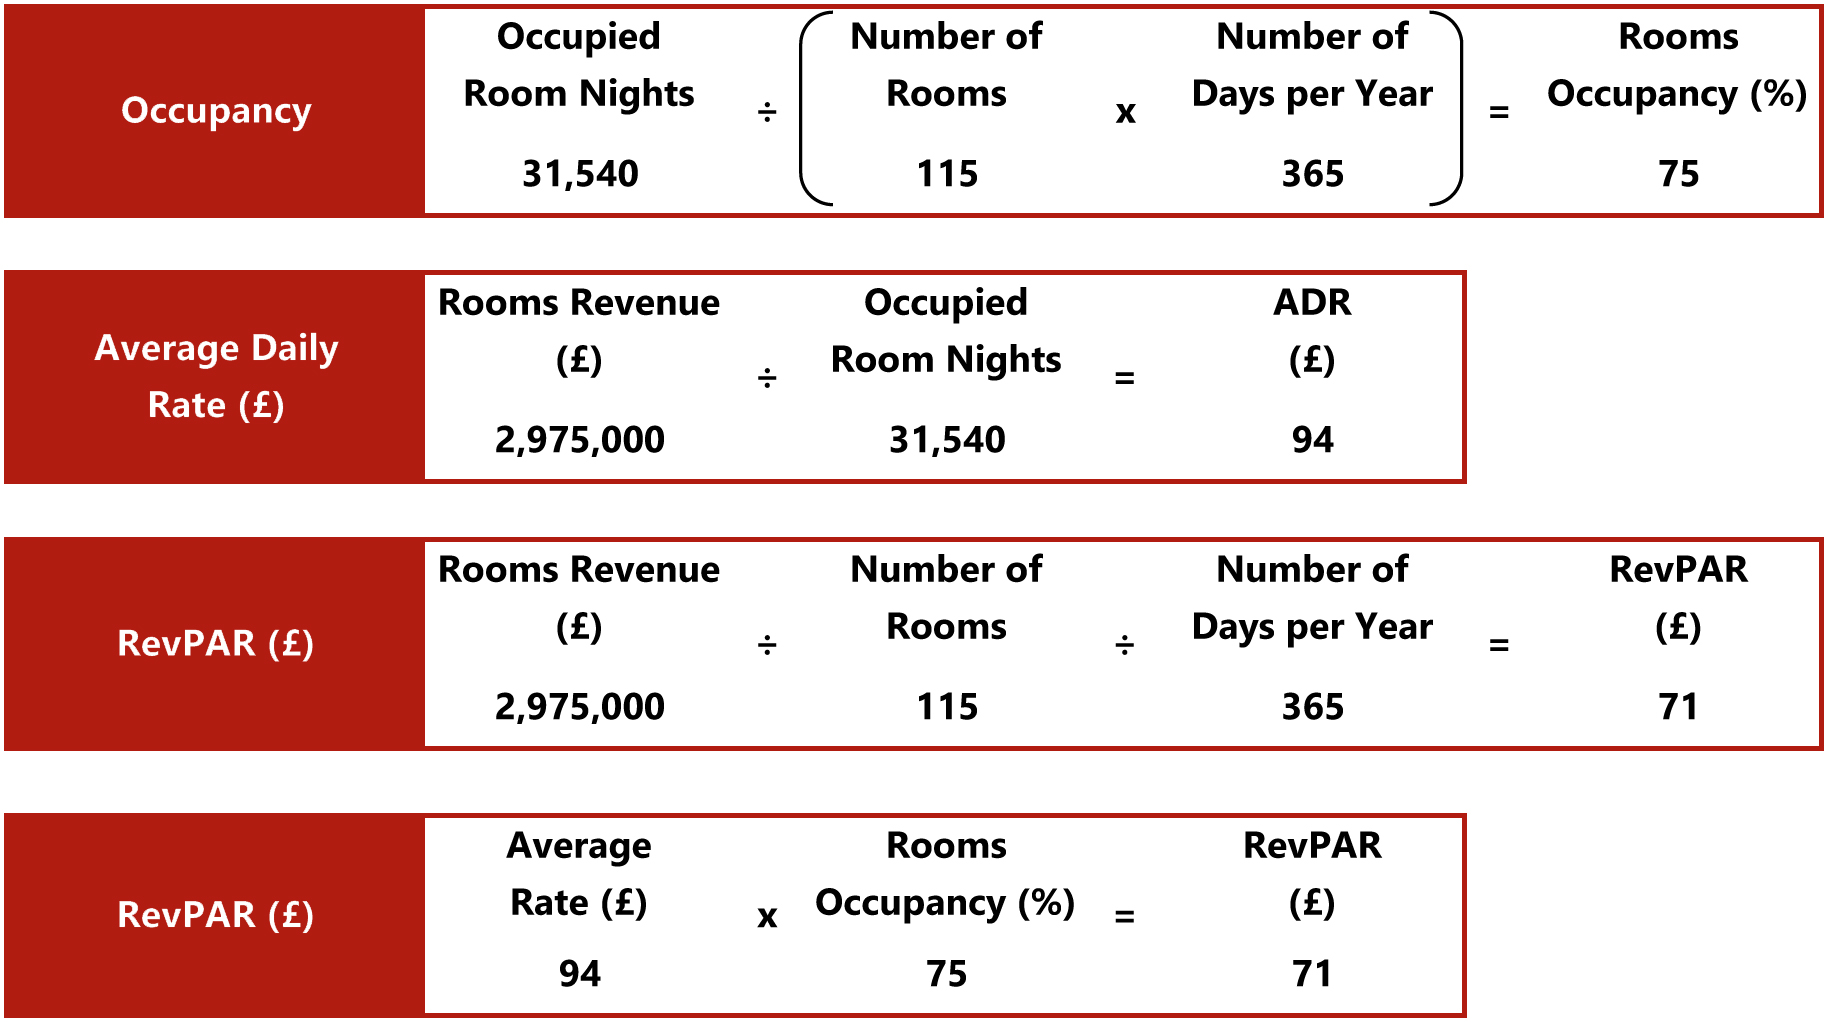
Table 1: Calculation of Rooms Occupancy, ADR & RevPAR— Photo by HVS Research
A further pitfall of measuring solely RevPAR is that this metric tends to penalize a larger hotel. In equal market conditions, a 100-room hotel should achieve higher occupancy levels than a 200-room hotel, especially when there are seasonal peaks and troughs (or even fluctuation between weekday and weekend occupancy levels). As a result, RevPAR of the larger hotel is likely to be lower than that of the smaller hotel. Therefore, hoteliers and potential investors need to consider size and profitability when comparing the performance of a specific hotel in relation to other hotel properties. In many cases, owing to economies of scale and incremental revenues, a larger hotel may well have a healthier financial performance than a smaller hotel with a higher RevPAR.
Additionally, and perhaps most importantly, hotel values are typically based on net free cash flows rather than total revenues. While RevPAR is somewhat related to a hotel’s value, it is not necessarily adequately correlated to the income capitalization value of a hotel property. However, it can be said that changes in hotel values are often highly correlated to changes in RevPAR (reflecting an elastic relationship).
-
TRevPAR and GOPPAR
Once RevPAR had been taken up as the primary KPI in the industry, the understanding that other revenue sources needed to be taken into consideration for a fair comparison amongst hotels led to the recognition of TRevPAR (Total Revenue per Available Room). This KPI incorporates net revenues from all operating activities, thereby giving a better indication of how the entire hotel is performing. While RevPAR and TRevPAR may be very close for limited-service properties, the difference between the two can be significant for full-service hotels, resorts, convention hotels and so forth. However, although TRevPAR includes revenues from all revenue streams, it still does not account for the differing contribution margins.
GOPPAR is defined as total Gross Operating Profit Per Available Room, where Gross Operating Profit (GOP) is equal to total revenue less the total departmental and undistributed departmental operating (overhead) expenses, thus accounting for movement in both revenues and operating costs.
While GOPPAR does not indicate the revenue mix of a hotel property and therefore does not show an evaluation of the individual departments, it does provide a clear indication of a hotel’s profit. Furthermore, GOPPAR can, in most cases, better reflect the profitability, management’s efficiency, and underlying value of hotel properties, as a whole. HVS London’s previous analysis illustrated that GOPPAR has a direct correlation of between 85% and 90% with a hotel’s value, while RevPAR has a correlation of approximately 70% to 75%.
As such, GOPPAR provides a more reliable measure for hotel valuations when compared to RevPAR and should therefore be used as a more reliable basis for hotel investment analyses. A high RevPAR does not necessarily imply a high bottom line and thus a high value; while a high GOPPAR reflects a high bottom line as well as a more reliable indication of value for the property for ‘quick and dirty’ hotel investment analyses, as indicated in Table 2.
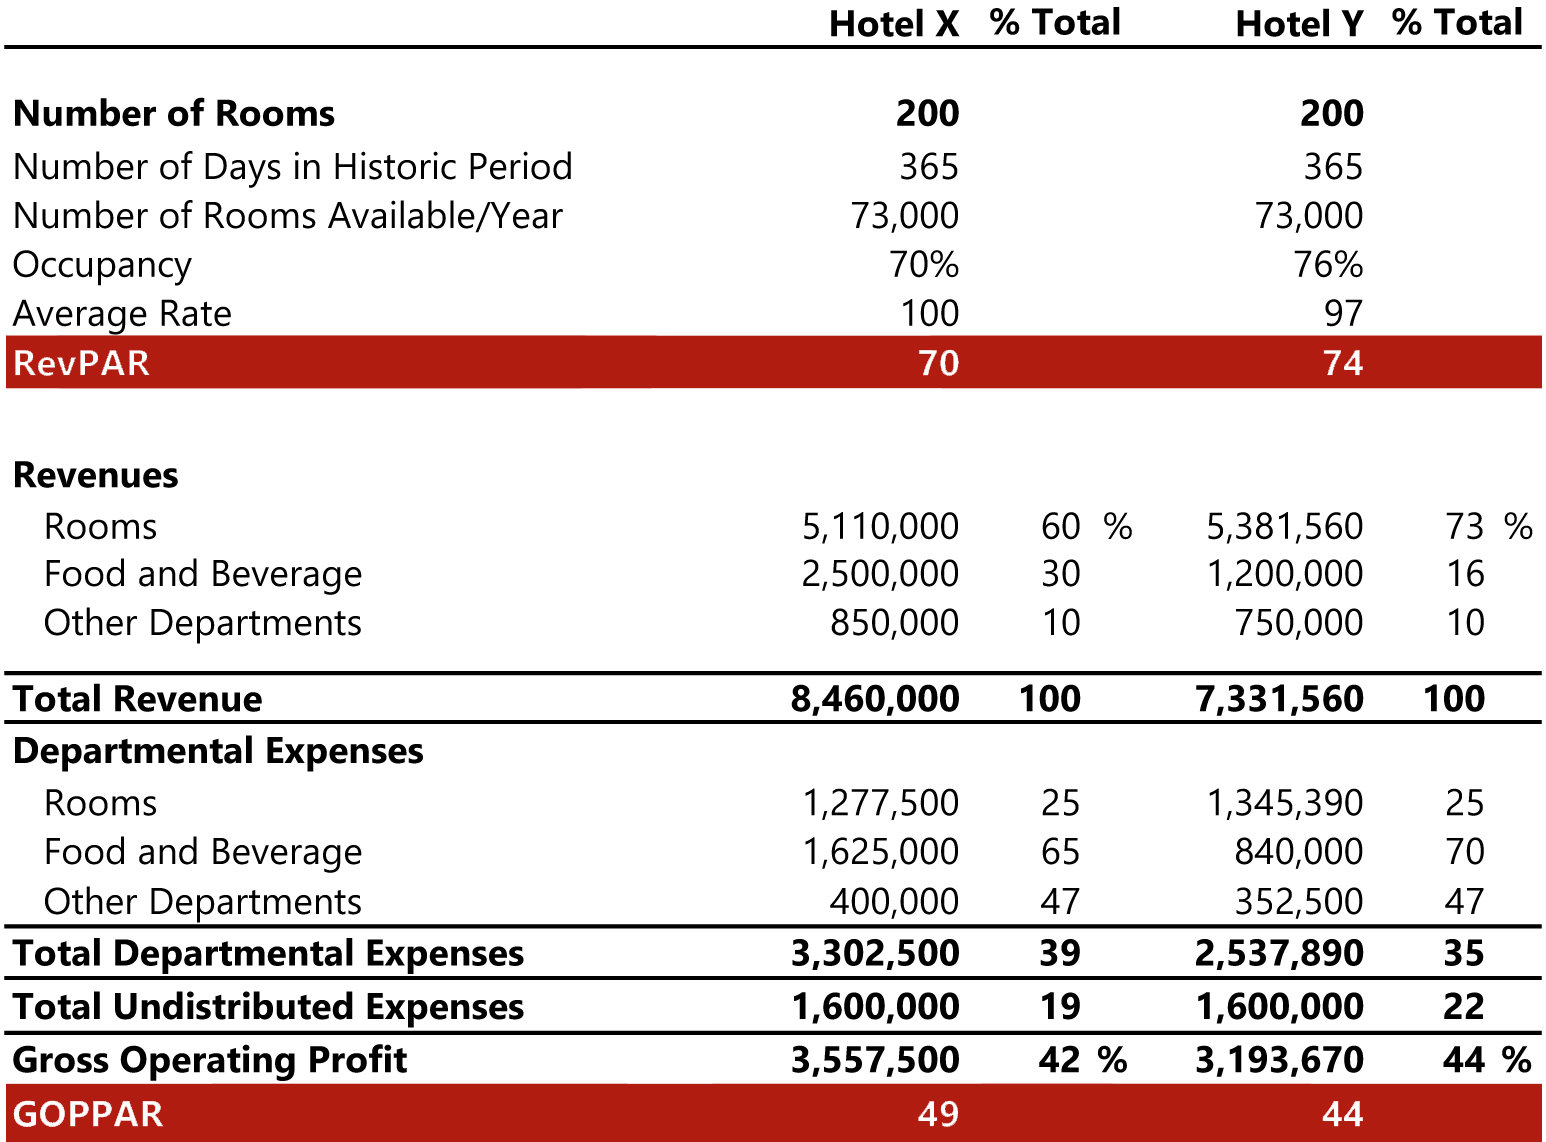
Table 2: GOPPAR Illustration— Photo by HVS Research
In the above example, Hotel Y would appear to be the stronger performer when looking exclusively at RevPAR. However, owing to the significant contribution of F&B to GOP, Hotel X in fact has the stronger GOPPAR. All else being equal, this hotel would also likely have the higher value.
As mentioned earlier, for some hotels rooms revenue is less important and can account for only half of the total revenue or less. Additionally, there are many hotels which have significant space designated for conferences and banquets, lobbies and non-revenue-generating public spaces.
KPIs such as GOPPAR and TRevPAR may look at a hotel’s performance in regard to its room inventory management; however, it is equally as important to measure and understand the profitability of the entire building.
TRevPAR and GOPPAR better incorporate other income streams, but can only be used to show how the hotel is doing as a whole; they do little to inform management of what departments may be underperforming owing to the poor application of revenue management techniques.
-
RevPAM and GOPPAM
RevPAM and GOPPAM, as the names imply, are defined as a hotel’s total revenue or profit per available (square) metre. The following table illustrates the computation of RevPAM and GOPPAM for selected comparable hotels.
A major benefit of using these two indicators as KPIs is that they take the entire space of the hotel into the equation, thus measuring the profitability of the building as a whole. Hoteliers can get more granular with their revenue management strategies, which becomes especially useful for hotels that generate incremental revenue through conferences and banqueting as these metrics are able to measure the utilisation efficiency of the entire property.
Hotels that have spaces that go beyond just accommodation need to focus on creating, promoting and optimising the offering that utilises those spaces. For example, as demonstrated in Table 3, Hotel A and Hotel B have an equal number of rooms (300) and perform at the same RevPAR of £70. Hotel A, however, has a larger conference & banqueting space and a total available space of 25,000 m². Hotel B, on the other hand, has a total available space of 20,000 m². With only 100 rooms and significantly fewer other spaces, Hotel C has a total available space of 7,000 m². Owing to the additional function space, Hotel A is able to generate more revenue resulting in a higher TRevPAR at £124, 7% more than Hotel B (£116) and 21% more than Hotel C (£102). In terms of GOPPAR, which accounts for all operating expenses, most of which include both fixed and variable portions, Hotel A is also overperforming by approximately 4% higher than Hotel B (£48 compared to £46) and 17% higher than Hotel C (£41).
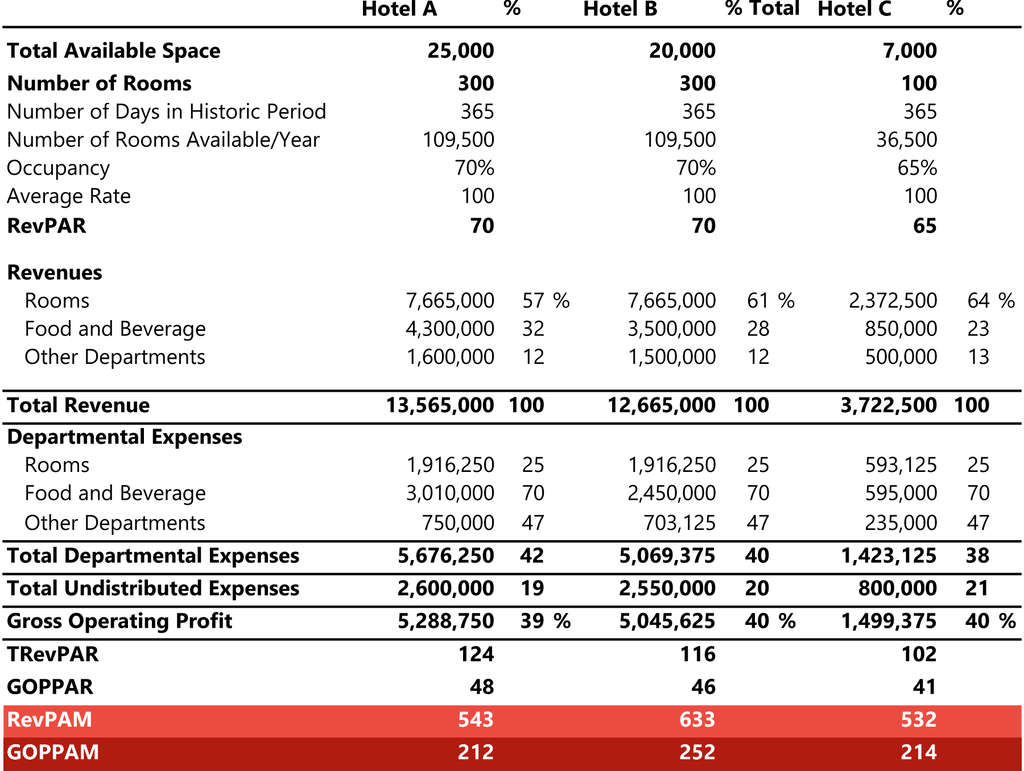
Table 3: RevPAM and ProPAM Illustration— Photo by HVS Research
However, if we take a look at the RevPAM and GOPPAM KPIs, which allow a hotel to measure the full impact of its revenue management strategies across all areas of the hotel, we can see that Hotel A is generating 14% less revenue and 16% less profit on a per available square metre basis than Hotel B. More interestingly, compared to Hotel C, Hotel A generates a higher RevPAM (+2%) but a lower GOPPAM (-1%).
This illustrates that RevPAM and GOPPAM do not always correlate with RevPAR or GOPPAR, and should be taken into account when evaluating a hotel’s financial health. Hoteliers and investors need to pay attention to these new KPIs during new builds and major renovations to optimise facilities and space, to drive ROI and ultimately optimise value per square metre. Many hotels face capacity utilisation issues as they attempt to maximise revenues because unused or misused spaces represent missed revenue-generating opportunities.
In the example of Hotel A, above, when the additional meeting space is not used for conferences or banqueting events, it could be used for instructor-led classes; wasted restaurant space can be transformed into an additional revenue-generating amenity for hotel guests; excess lobby space can be used to create a pop-up bar/kitchen which can attract in-house guests as well as local residents.
Past case studies have shown how hoteliers can successfully be creative; for example, the conversion of three underutilised treatment rooms into a ‘gentlemen’s boxing club’, which both paid a rent to the hotel and required all members to purchase a spa membership to join.
Other examples include outdoor spaces that have been optimised to drive additional revenue through the creation of rooftop terraces and garden bars; underutilised meeting rooms have been converted into rent-paying recording studios; and empty lobbies have become home to co-working spaces and pop-up stores.
6. Cost of Capital
The capital you use to finance a deal comes with defined risk and return requirements. The capital stack is an intuitive representation of this with least risk on the bottom and most risk at the top – senior debt and common equity, respectively. The hotel will only produce so much cash flow, and these different tranches claim ownership of that cash flow based on their contractual position in the deal.
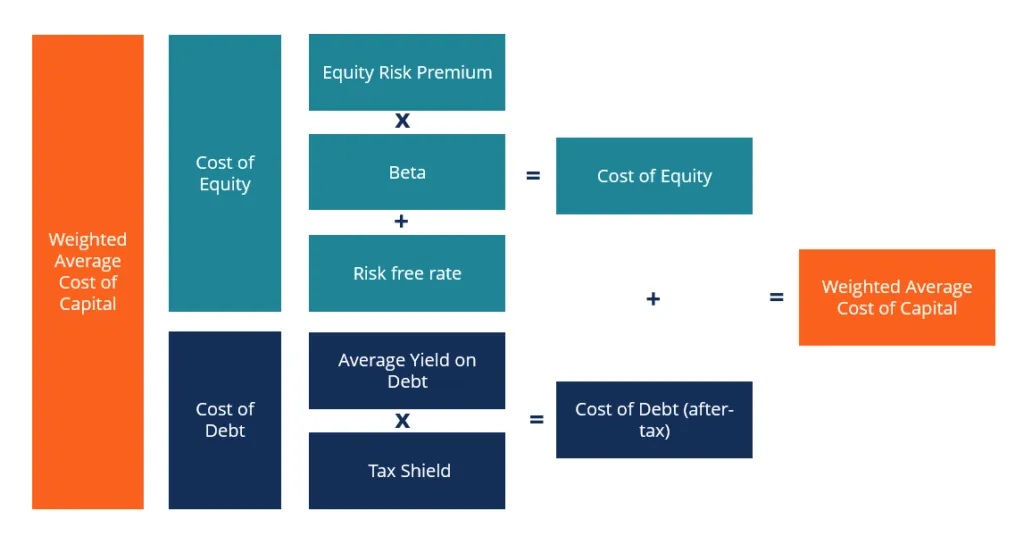
Each investor in your capital stack has a target return. The blended cost of capital is the contractual payments divided by capital invested. Your profit as a deal sponsor is the difference between the cost of capital and deal return.
As an example, assume you have a loan with an interest rate of 6.00% on 70% of the capital and a joint venture partner that is looking for a 18.00% return on 25% of the capital. This leaves you with an 8.70% blended cost of capital (6.0%*70% + 18.0%*25%). That means you need to come up with 5% of the capital stack, and you’ll keep everything beyond 8.70% unlevered return. This emphasizes the importance of unlevered analysis when learning how to underwrite a hotel.
Note, your lenders are paid monthly, but equity investors understand that they must wait their turn with available cash for distribution. That said, the value of money is associated with time. An investor’s return requirement will be satisfied with less absolute money in year one than in year two.
7. Investment Returns
Profitability is evaluated with absolute and relative measurements. Absolute profitability is the sum of all cash flows minus invested equity. This is more elegantly stated in the multiple on invested equity (MOE), which is calculated by sum of cash flows divided by equity invested.
Relative profitability is commonly measured with two return metrics – cash-on-cash return and internal rate of return (IRR). Generally, private investors prefer the former, while institutions prefer the latter.
Internal rate of return is a discounted cash flow approach to estimate the annual compounded return on equity including capital events. Business plans that rely on capital appreciation, like value add and opportunistic deals, favor this approach because net cash flow in the early years is limited if non-existent. Institutional investors prefer this approach because it fits well in modeling the way each deal will fit into their fund portfolio.
Cash-on-cash return is the net cash flow after debt service divided by equity invested. This provides a clear annual percentage return on investment that ignores capital events. Private and conservative institutional investors like this approach because it doesn’t attempt to project asset appreciation. It gives a clear picture of the annual income to be expected from an investment.
Internal rates of return are susceptible to excessive financial engineering. As you learn how to underwrite a hotel, you’ll also learn how to pull the right strings to get to a return target. Still, a good deal based on sound fundamentals will always be a good deal.
Conclusion
Each investor has a different approach to analyzing a deal. Experienced investors have a cocktail of data points, which they can use to evaluate a deal on the back of an envelope. Underwrite every opportunity that comes across your desk to find the right mix that works for you. Experience is the best and most efficient way to learn how to underwrite a hotel deal.
Note: This article is written based on the writings of John Wijtenburg (HIT Advisory, LLC) & Christopher Boyd, Russell Kett (HVS)
You might also like


Leave a Reply
Want to join the discussion?Feel free to contribute!